This week marks the fifth anniversary of the Economic Research Council’s Chart of the Week.
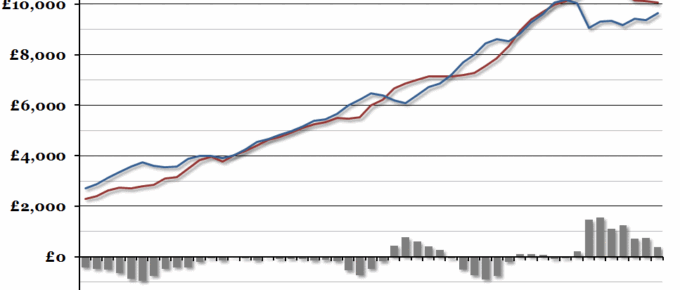
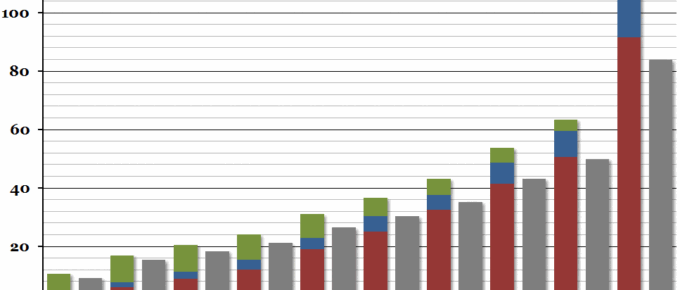
Chart of the Week: Week 11, 2016: UK Central Government Finances
We’ve updated our annual chart on central government finances per person in time for this afternoon’s UK Budget speech.
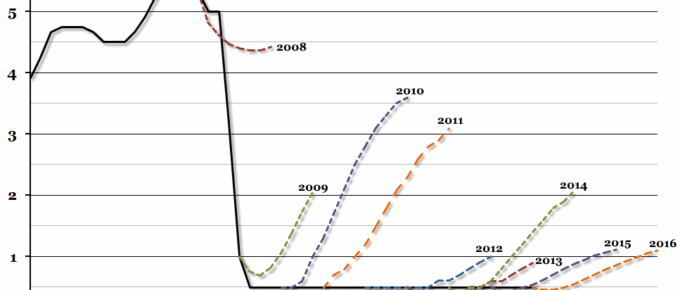
Chart of the Week: Week 10, 2016: UK Interest Rate
Saturday marked the seventh anniversary of the Bank of England’s introduction of the emergency 0.5% Bank Rate.
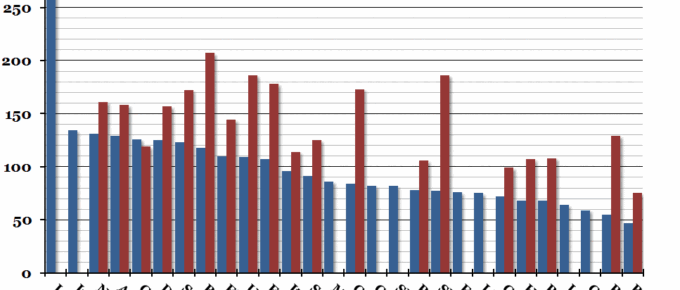
Chart of the Week: Week 9, 2016: EU GDP Per Capita
At the end of last week, Eurostat released a report on regional GDP per capita across the EU.
Chart of the Week: Week 8, 2016: UK Income Distribution
The Office for National Statistics released a report yesterday on household income for the financial year 2014/15.
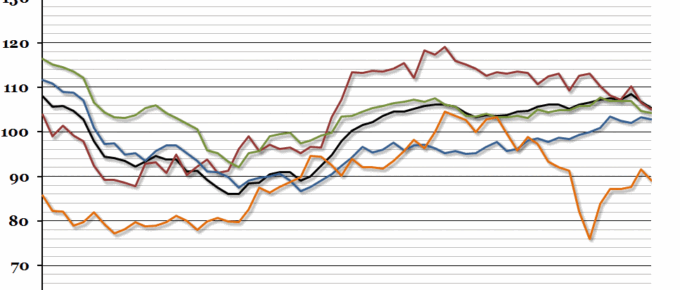
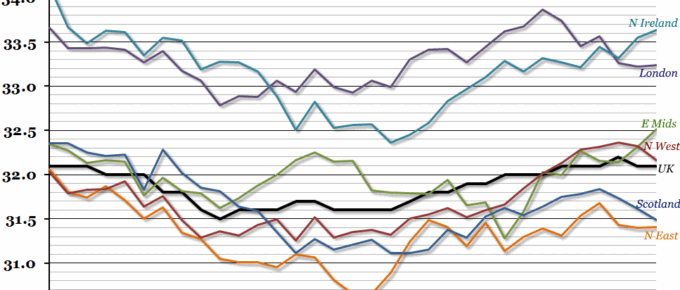
Chart of the Week: Week 7, 2016: Hours Worked by Region
According to today’s labour market report from the ONS, total hours worked in the UK reached a new peak in the final quarter of 2015.

