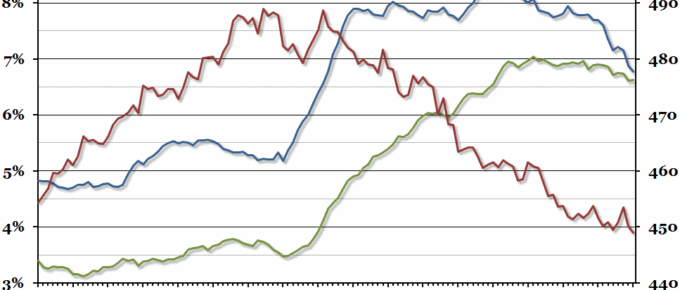
The official UK unemployment rate continued its sharp decline in the three months to March.
Chart of the Week: Week 19, 2014: UK Healthcare Spending
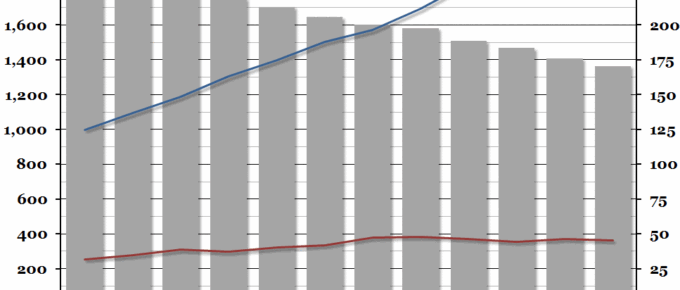
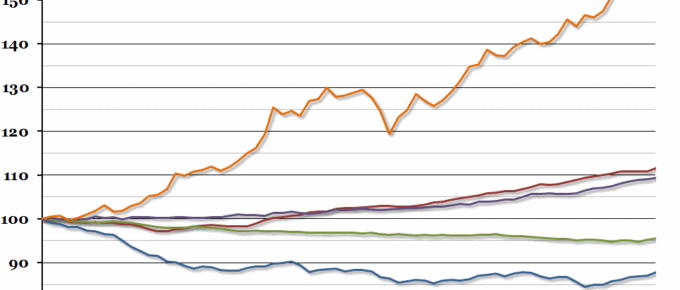
Per capita healthcare spending in the UK has slowed down massively since the 2008 recession, with spending on private healthcare decreasing even in nominal terms since the peak in 2007.
Chart of the Week: Week 18, 2014: International Post-Recession Recovery
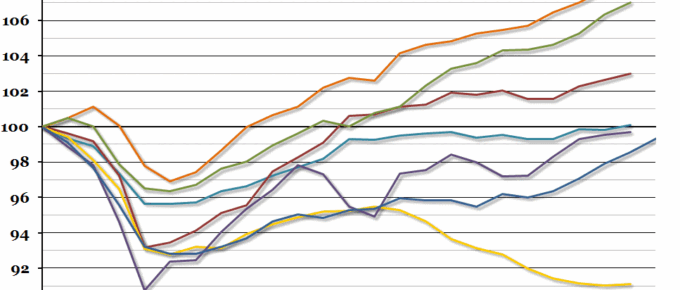
A preliminary estimate of Q1 GDP released by the Office for National Statistics yesterday suggested quarter on quarter growth of around 0.8%.
Chart of the Week: Week 17, 2014: Historical UK Government Debt
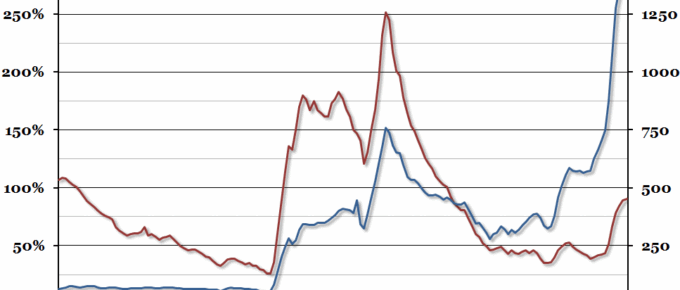
The latest public sector finances were released this morning, so we decided to update our chart from this time last year showing historical UK government debt going back to 1855 (this time in 2013 prices).
Chart of the Week: Week 16, 2014: Employment by Age Group
Data released today show that UK employment continued to increase, with the unemployment rate down to 6.9%.
Chart of the Week: Week 15, 2014: UK Trade
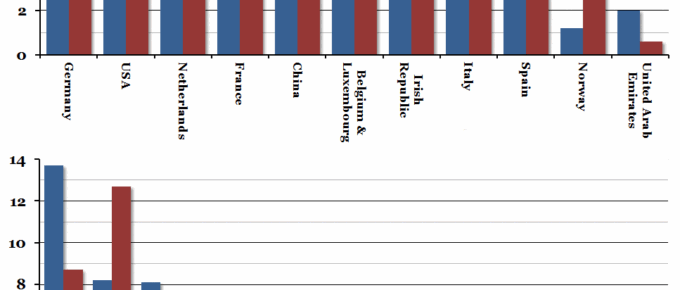
This morning, official trade statistics were released for 2013, which included details on the top import and export markets for the UK, and what commodities are traded.

