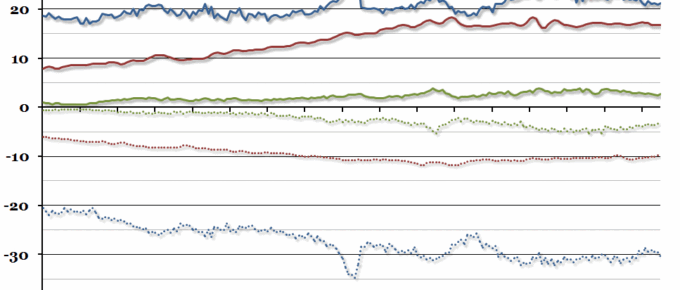
Last week it was reported that the UK’s balance of trade deficit increased to an estimated £3.3bn in July, compared to £2.4bn the previous month.
Chart of the Week: Week 35, 2014: Public Sector Net Borrowing
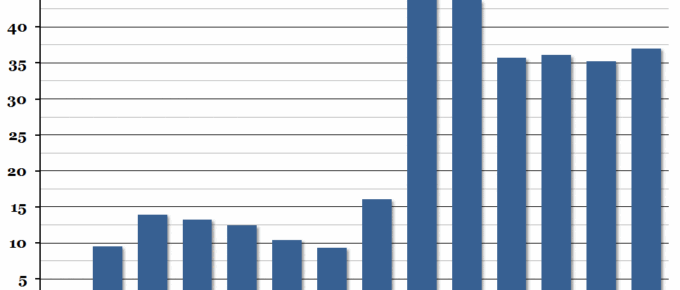
Government financial statistics were released at the end of last week, showing that public sector net borrowing was higher in the first third of the financial year than in any other since 2010.
August 2014
Global trade and a great deal of prosperity generated over the last decade or so has depended on the free movement of goods and people. In the last few months there has been an insidious and growing disruption to both. The shooting down of the Malaysian airliner over Ukraine has caused a hidden but very major disruption to airline routes. It had been assumed that airlines …
Chart of the Week: Week 33, 2014: Weekly Hours Worked
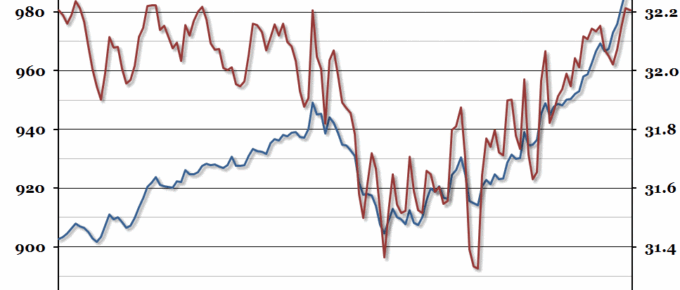
The labour market recovery is now in full flow with unemployment falling to 6.4% in the second quarter of 2014.
Chart of the Week: Week 31, 2014: UK Recessions and Recoveries
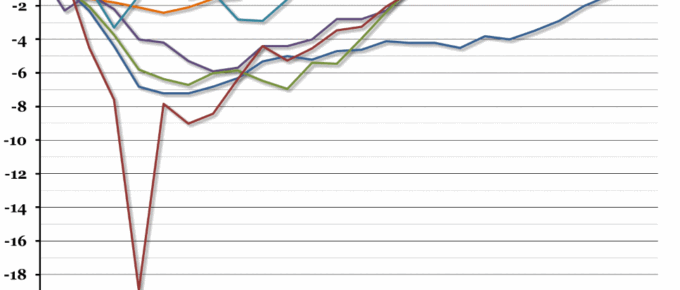
The preliminary estimate of GDP growth for the second quarter of 2014, released at the end of last week, suggested that the UK economy has finally overtaken the previous peak of output before the recession in 2008.
Chart of the Week: Week 30, 2014: UK Housing Affordability
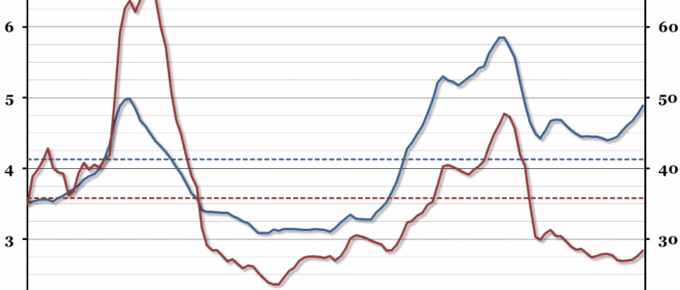
This year, our annual chart on housing affordability shows quite a dramatic increase in the house price to earnings ratio, and unlike last year, mortgage affordability has also declined.

