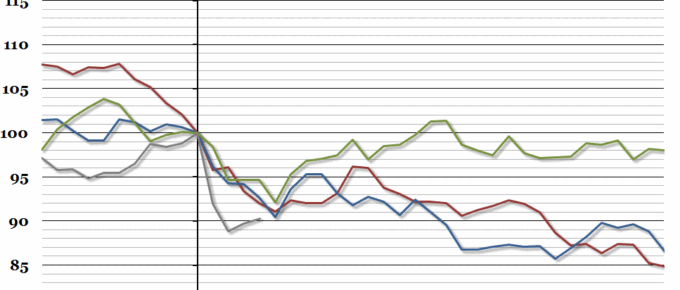
As a result of last Thursday’s “Brexit” referendum, the British pound suffered two days of intense devaluation, and although it has steadied in the last 24 hours, this week’s chart shows that this has been the sharpest 2-day fall since the era of free-floating currencies began in 1971.
Chart of the Week: Week 25, 2016: UK Government Revenue
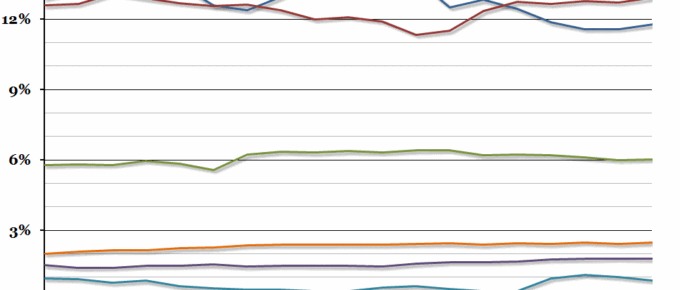
Yesterday, the Office for National Statistics released updated figures for the UK government finances in the financial year 2015/16.
Chart of the Week: Week 24, 2016: Global Government Bonds
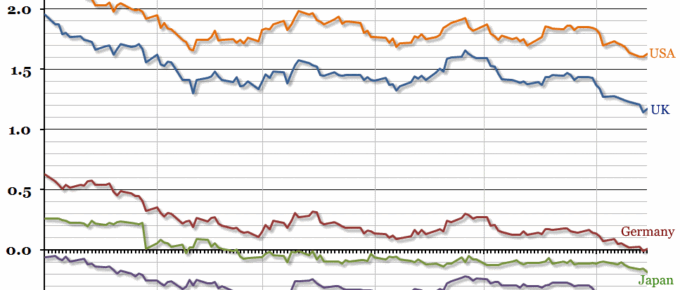
Government bond yields in most advanced economies reached record lows this week, with ten year German bond yields entering negative territory for the first time ever.
June 2016
It is likely that Britain will vote to Remain on the 23rd June, as the weight of vested interests will be supported by the status quo and the natural desire not to rock the boat! The entrepreneurial and adventurous spirit of Britain which has been waning for many years, will take a further beating….
Chart of the Week: Week 21, 2016: Regional Disposable Income
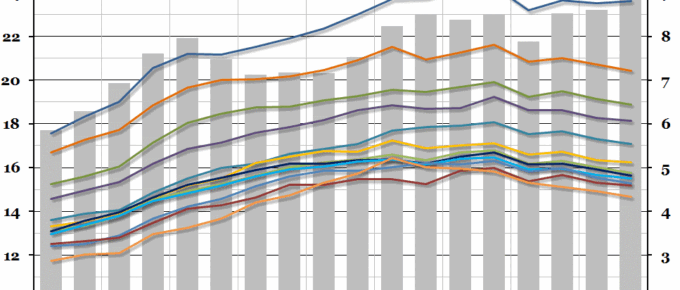
Data released by the ONS this morning showed that the gap in gross disposable income between the richest region of the UK (London) and the poorest (Northern Ireland) opened up to the largest it has been since records began in 1997.
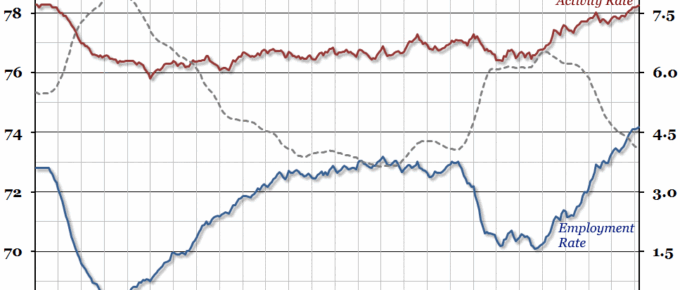
Chart of the Week: Week 20, 2016: UK Labour Market
Today’s labour market statistics (for the first quarter of the year) show that the unemployment rate remained at 5.1%, where it has been since November 2015.

