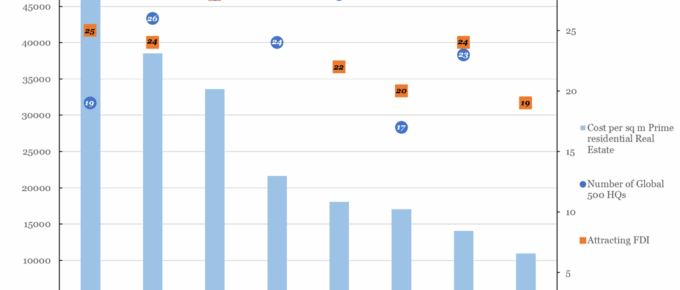
The chart shows that there is little to no correlation between the number of Global 500 companies headquartered in a city and the cost of prime real estate.
Chart of the Week: Week 23, 2015: UK House Prices
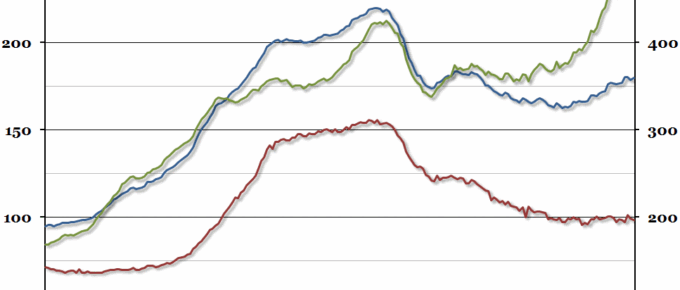
The Land Registry published their data on average house prices for April recently, and they showed that although the average price grew by just over 5% in nominal terms, this was the slowest annual growth rate since January 2014.
Chart of the Week: Week 30, 2014: UK Housing Affordability
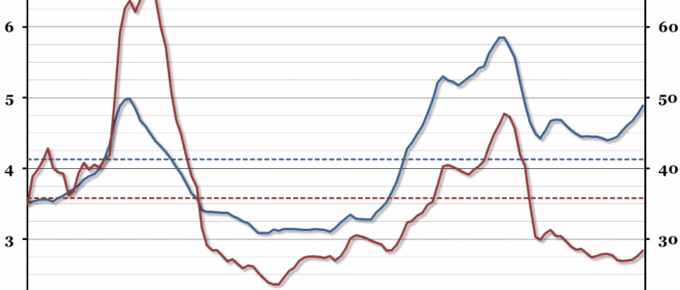
This year, our annual chart on housing affordability shows quite a dramatic increase in the house price to earnings ratio, and unlike last year, mortgage affordability has also declined.
Chart of the Week: Week 24, 2014: 2013 House Price Forecasts
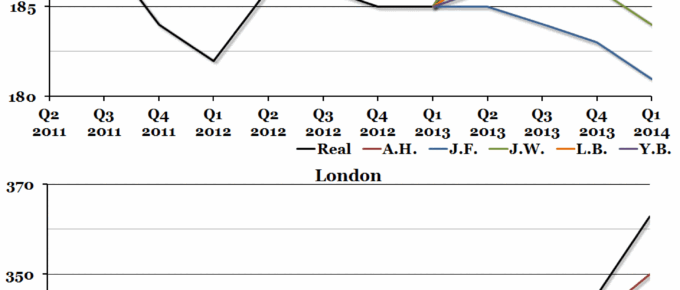
This time last year, the Economic Research Council invited four property experts to share their forecasts for house prices in the coming year.
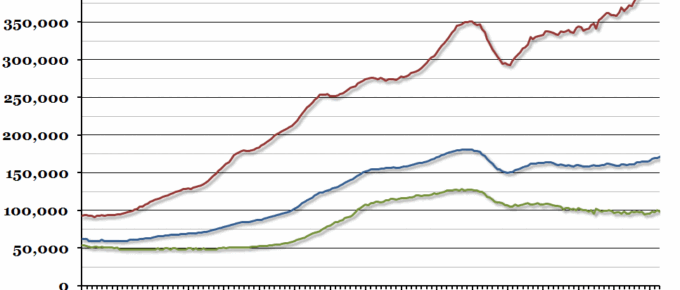
Chart of the Week: Week 23, 2014: Average House Prices
At the end of last week, the Land Registry published their House Price Index data for April 2014 which showed that over the whole of England and Wales, house prices went up by 1.5% on the previous month and 6.7% on the same time last year.

