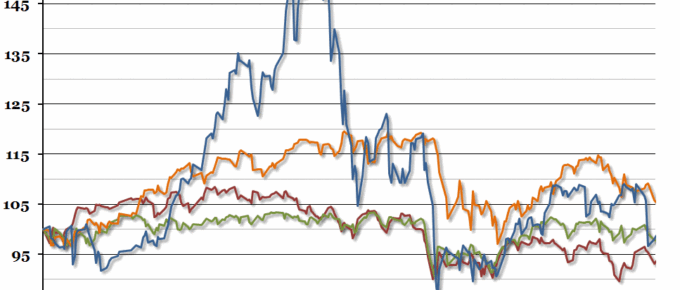
While we’ve been away over the Christmas break, global stock markets suffered another shock, which once again originated in China.
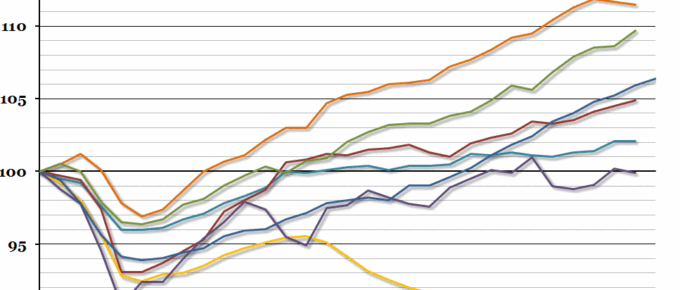
Chart of the Week: Week 43, 2015: International Post-Recession Recovery
Preliminary figures released by the Office for National Statistics yesterday suggested that UK GDP growth in the third quarter of the year was 0.5% – lower than the previous quarter’s growth rate of 0.7%, and the consensus forecast of 0.6%.
Chart of the Week: Week 38, 2015: International Comparison of Productivity
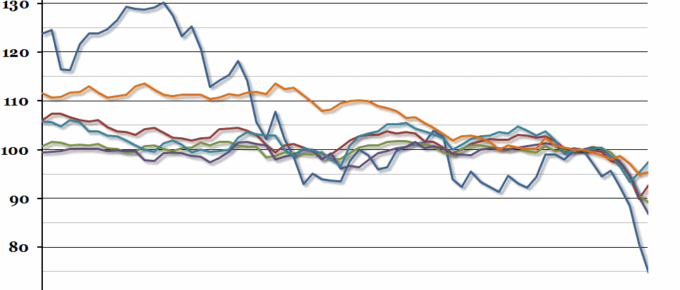
At the end of last week, the Office for National Statistics released their annual international comparison of productivity for 2014, and it showed that although the UK’s productivity increased very slightly, our relative position within the G7 worsened to the lowest point on record.
Chart of the Week: Week 34, 2015: Global Stock Markets
Since our chart on Chinese exchange rates last week, the global economic press has shifted focus from the currency to the stock markets.
Chart of the Week: Week 50, 2014: Inclusive Wealth Index
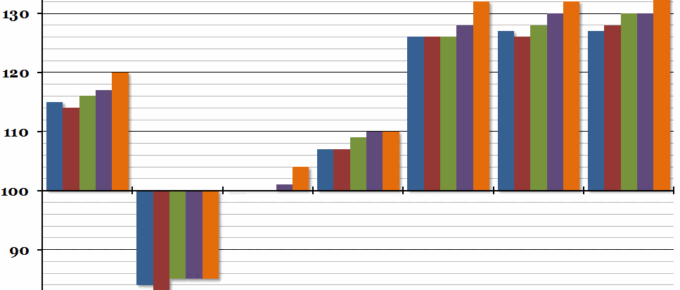
This week two departments of the UN released a joint report which put forward a new way of measuring a nation’s wealth.
Chart of the Week: Week 11, 2014: Global Debt
This week, the Bank of International Settlements published their Quarterly Review, which included an interesting chart showing the estimated level of outstanding global debt.

