This week two departments of the UN released a joint report which put forward a new way of measuring a nation’s wealth.
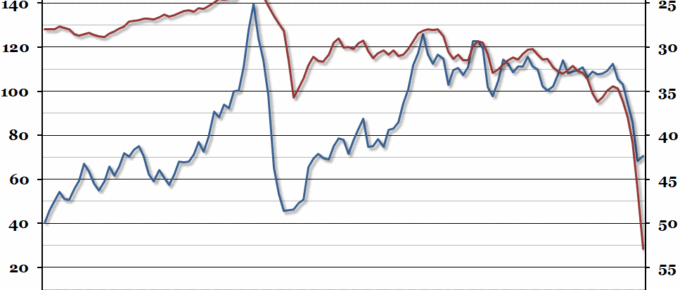
Chart of the Week: Week 49, 2014: Oil Prices
Over the past few months, the price of oil has fallen dramatically from over $110 per barrel to under $70.
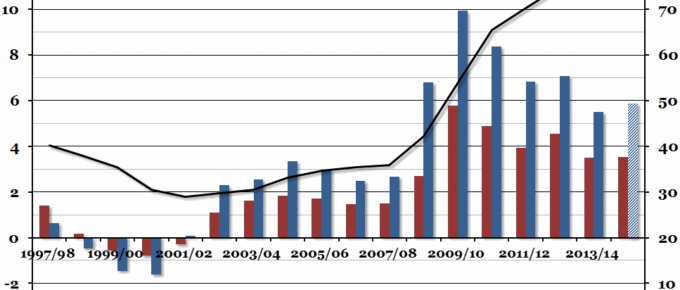
Chart of the Week: Week 48, 2014: UK Public Sector Finances
Government finance figures were released at the end of last week, and they suggested that the government deficit in 2014/15 may end up higher than it was during 2013/14 – and the sixth highest in the last twenty years.
November 2014
These enormous economic changes leave us with a certainty that predicting the course of events is a lot more difficult and policies that try to maintain the status quo are doomed. This is particularly relevant in Europe where….
Chart of the Week: Week 47, 2014: Profitability of UK Companies
The non-financial services sector set a new record for profitability in the second quarter of 2014, continuing the strong services recovery since 2011.
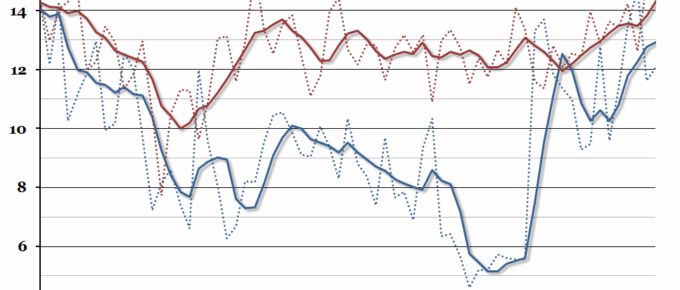
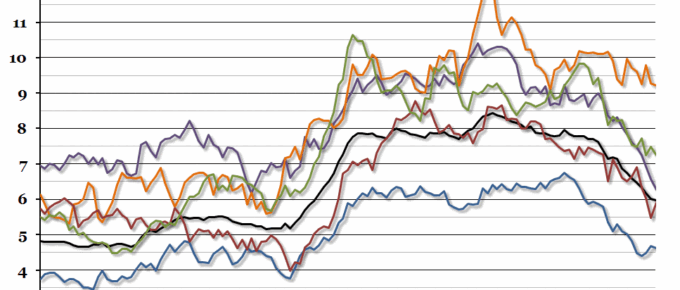
Chart of the Week: Week 46, 2014: Regional Unemployment
The UK unemployment rate in the third quarter of this year was announced today, and it has continued to fall to 6% – the lowest level since 2008.

