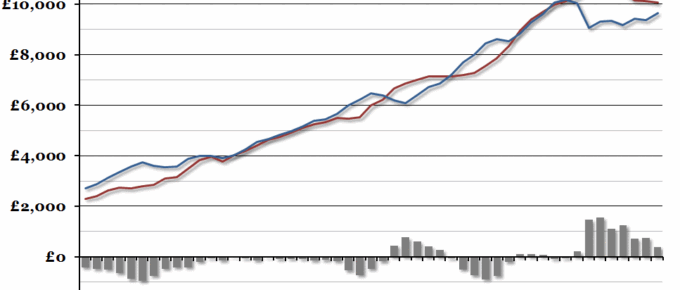
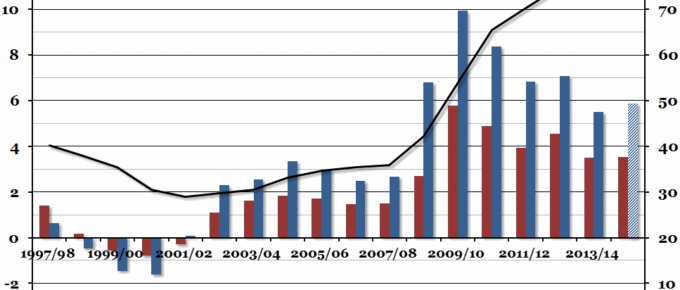
We’ve updated our annual chart on central government finances per person in time for this afternoon’s UK Budget speech.
Chart of the Week: Week 27, 2015: EU Government Spending
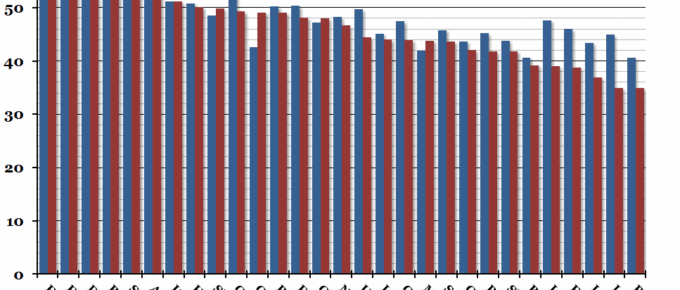
With the UK Budget due later today, this week’s chart compares total government spending, as a percentage of GDP, across all the EU countries.
Chart of the Week: Week 11, 2015: UK Central Government Finances
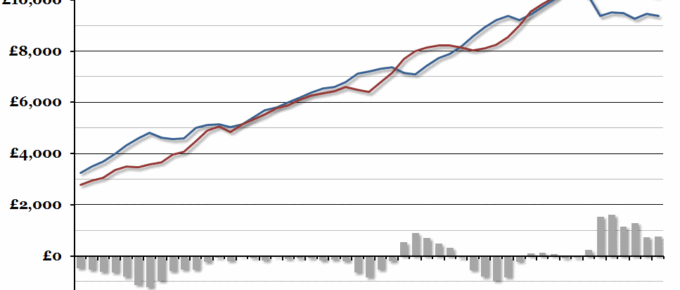
With the annual UK Budget due this afternoon, we’ve updated our yearly chart showing the central government finances per person.
Chart of the Week: Week 10, 2015: Current Budget Deficit
This morning, the Scottish Government released their annual report on their finances covering the period up to 2013/14.
Chart of the Week: Week 48, 2014: UK Public Sector Finances
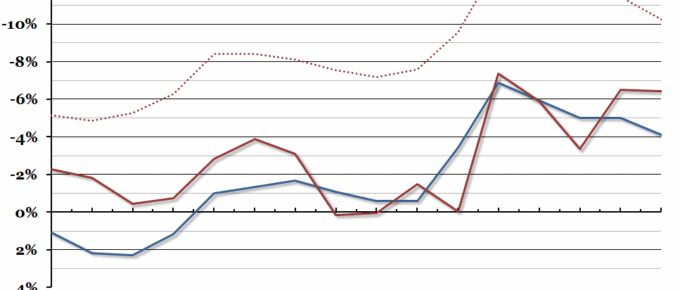
Government finance figures were released at the end of last week, and they suggested that the government deficit in 2014/15 may end up higher than it was during 2013/14 – and the sixth highest in the last twenty years.
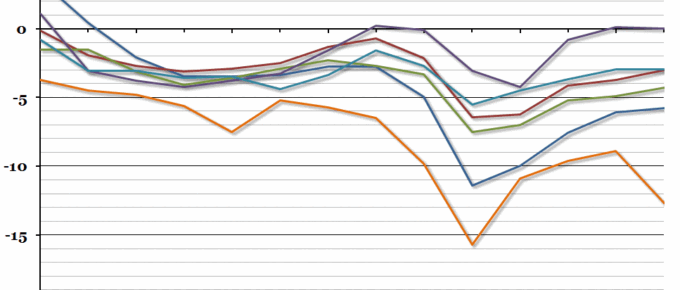
Chart of the Week: Week 39, 2014: European Government Deficits
UK public sector finances were released yesterday, showing that the deficit so far this financial year is higher than last year.

