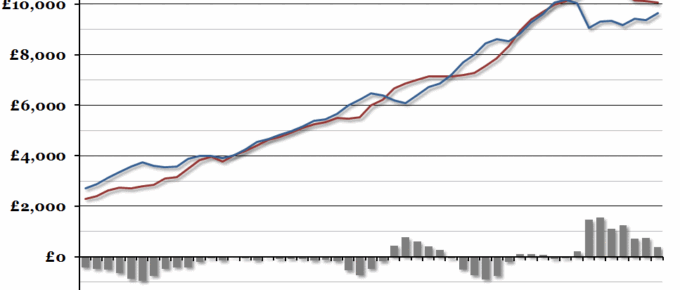
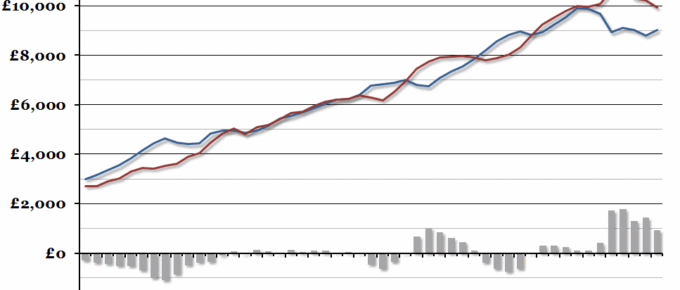
We’ve updated our annual chart on central government finances per person in time for this afternoon’s UK Budget speech.
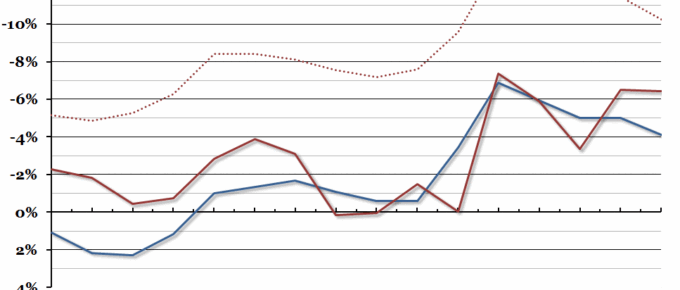
Chart of the Week: Week 10, 2015: Current Budget Deficit
This morning, the Scottish Government released their annual report on their finances covering the period up to 2013/14.
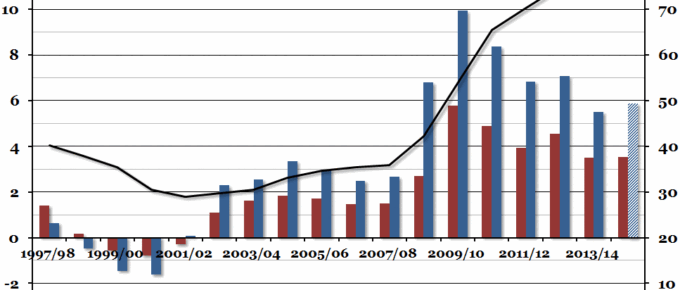
Chart of the Week: Week 48, 2014: UK Public Sector Finances
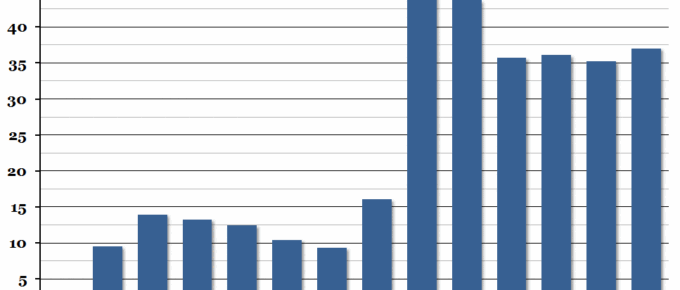
Government finance figures were released at the end of last week, and they suggested that the government deficit in 2014/15 may end up higher than it was during 2013/14 – and the sixth highest in the last twenty years.
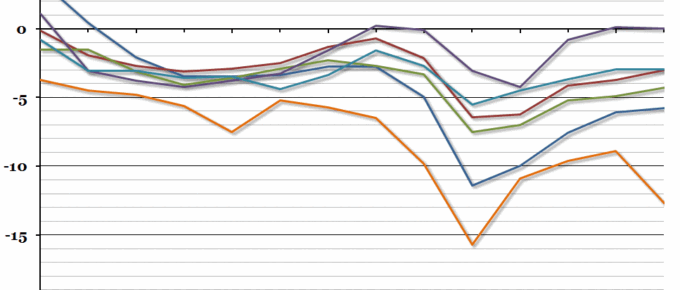
Chart of the Week: Week 39, 2014: European Government Deficits
UK public sector finances were released yesterday, showing that the deficit so far this financial year is higher than last year.
Chart of the Week: Week 35, 2014: Public Sector Net Borrowing
Government financial statistics were released at the end of last week, showing that public sector net borrowing was higher in the first third of the financial year than in any other since 2010.
Chart of the Week: Week 12, 2014: UK Government Finances
This afternoon, the Chancellor will present the UK Budget for the coming year.

