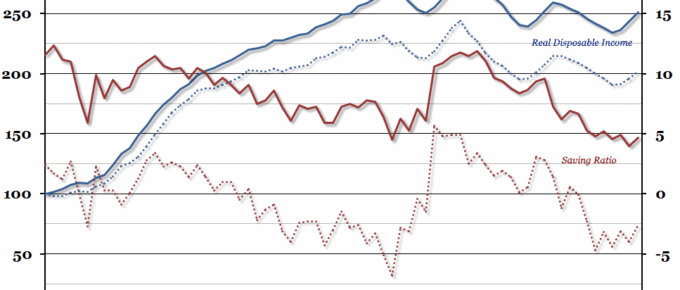
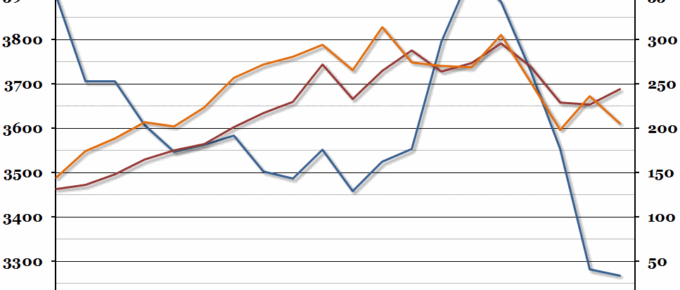
On Monday, the Office for National Statistics issued a revised measure of both real household disposable income and the household saving ratio, which made them seem worse than previously thought.
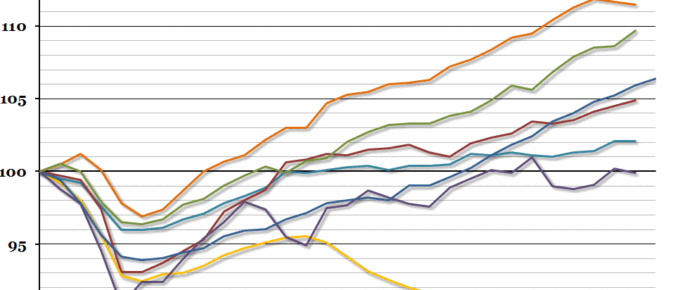
Chart of the Week: Week 43, 2015: International Post-Recession Recovery
Preliminary figures released by the Office for National Statistics yesterday suggested that UK GDP growth in the third quarter of the year was 0.5% – lower than the previous quarter’s growth rate of 0.7%, and the consensus forecast of 0.6%.
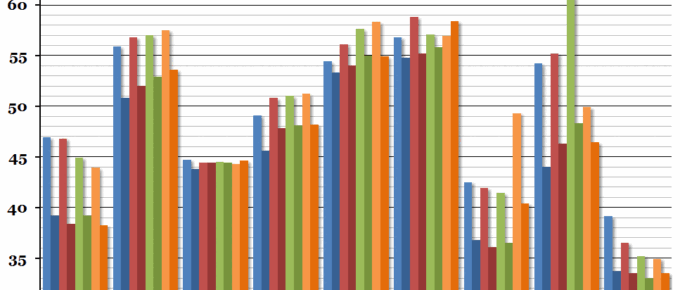
Chart of the Week: Week 42, 2015: EU Government Finances
Eurostat announced their updated statistics for European government finances this morning, and the headline figure showed that across the EU, the average deficit improved from 3.3% to 3%.
October 2015
China, which is on everyone’s worry list, is doing exactly what it said it would do, and that is reduce the economy’s reliance on exports and infrastructure building. The country generally is becoming …..
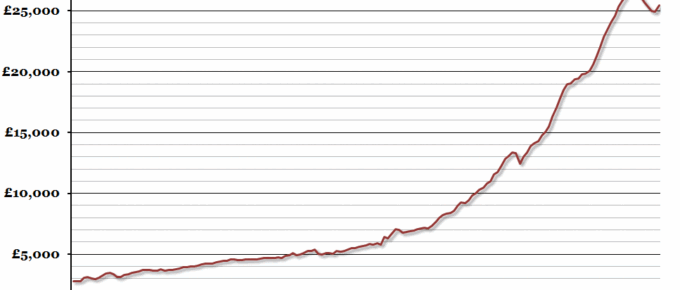
Chart of the Week: Week 41, 2015: Historical Real Average Salary
According to data released this morning, earnings growth remained strong in the three months to August at 2.8% in nominal terms.
Chart of the Week: Week 40, 2015: UK Workless Households
The annual study from the ONS on workless households in the UK was released yesterday, and it showed a mixed picture with total workless households continuing to fall but the number of households where nobody has ever worked growing.

