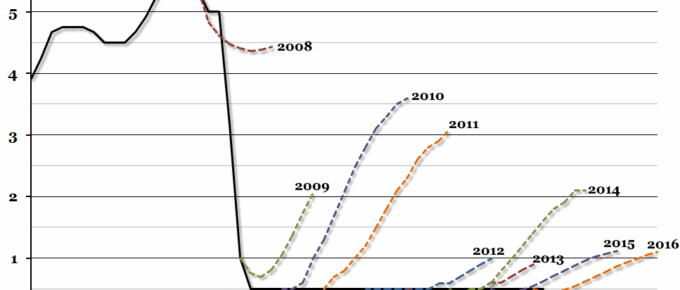
UK interest rates remain at the historic “emergency” low of 0.5% set by the MPC in March 2009, and financial markets have consistently overestimated the likelihood of a rate rise since then.
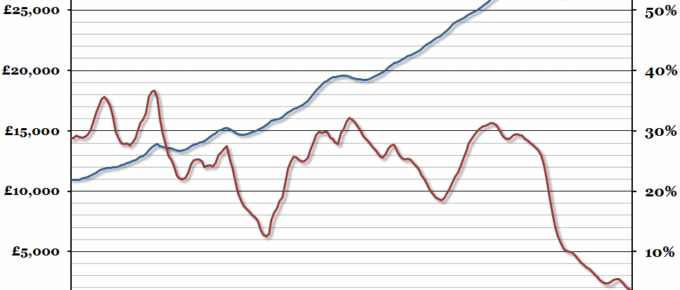
Chart of the Week: Week 30, 2016: UK GDP Per Capita
The preliminary estimate for GDP growth in the second quarter of 2016 was 0.6%, slightly higher than in the first quarter of the year.
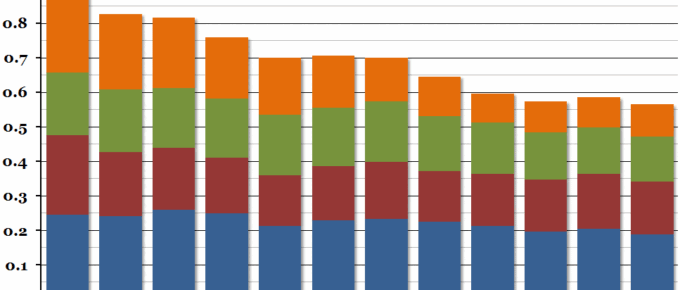
Chart of the Week: Week 29, 2016: Science, Engineering and Technology Spending
The Office for National Statistics released their annual report on government spending on science this week, and although in nominal terms spending has increased by more than £2 billion since 2003, it has fallen significantly as a proportion of GDP.
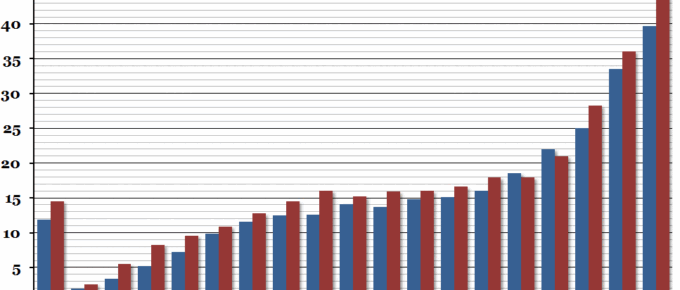
Chart of the Week: Week 28, 2016: Self Employment
The age distribution of self-employed people helps to reveal some of the possible causes of this shift away from traditional employment.
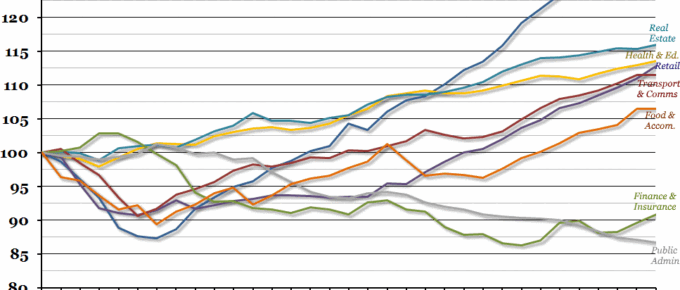
Chart of the Week: Week 27, 2016: UK Services Growth by Industry
The services sector is crucial to the UK economy. In the first quarter of 2016, it was only growth in that sector which kept overall economic growth positive, with the production industries in recession.
Chart of the Week: Week 26, 2016: UK Historical Exchange Rates
As a result of last Thursday’s “Brexit” referendum, the British pound suffered two days of intense devaluation, and although it has steadied in the last 24 hours, this week’s chart shows that this has been the sharpest 2-day fall since the era of free-floating currencies began in 1971.

