Summary
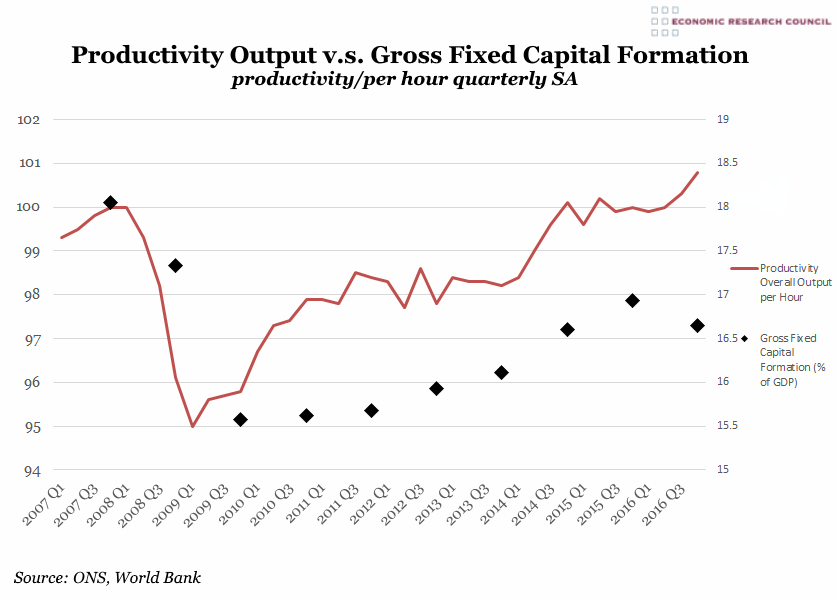
This chart shows the relationship between the level of gross fixed capital formation (GFCF) and the productivity of the economy. Unsurprisingly, it is higher before the financial crash, at just over 18% of GDP in 2007. The global financial crash caused a dramatic drop, beginning in 2008, and falling over 2.5% of total GDP to just over 15.5% in 2009. GFCF levels then rise in a relatively stable manner between 2009 and 2015, however do not recover to pre-crisis levels. The slow recovery to 2015 is followed by a decline in 2016, likely attributable to the outcome of the UK referendum on EU membership, an event that has caused investors across the board to hold off further capital expenditure.
Productivity, which comprises mainly services (79%) rather than goods, is clearly correlated to GFCF, however the former diverges from GFCF in 2016. This may be fuelled by previous investment in fixed capital but also sterling devaluation post-referendum will also have played a role; specifically, that the value as opposed to the volume of output may have risen.
What does the chart show?
The level of GFCF is a measure of all UK firms’ investment in fixed capital assets, less any assets of which they have disposed. The figure is annual, expressed as a percentage of total GDP, and is shown with black markers measured along the right hand axis. Productivity is shown as quarterly output per hour, seasonally adjusted and displayed by the red line measured against the left hand axis.
Why is the chart interesting?
Although productivity had recovered to pre-crisis levels by 2015, there has been much-publicised concern over UK productivity levels in general with UK workers accused of producing one fifth less in an hour’s work than their G20 counterparts. Although GDP has grown significantly since its pre-recession peak, this growth has been fuelled by an expansion of the workforce, as opposed to any greater efficiency or streamlined business practices. Evidence of this can be seen in relatively flat GDP per capita figures.
Measuring productivity is a vast and complex task, in which overall figures are liable to mask both success stories and inefficiencies. The manufacturing sector is highly variable and the difficulty in gauging productivity in complex service workplaces, such as hospitals or job centres, is immense.

