Summary
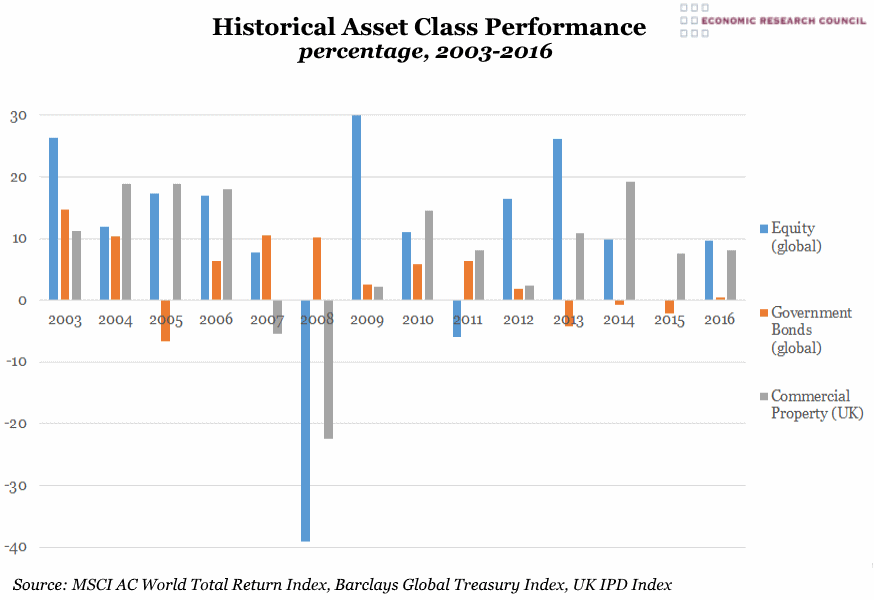
This chart shows a snapshot of the performance of different asset classes: UK commercial property, global government bonds and global equity since 2003. Overall, commercial property has yielded the highest percentage return on investment for half the years shown. Equity has yielded the highest returns in 5 out of the 14 years shown, displaying its sensitivity to the overall economic climate. This sensitivity can be seen following the 2008 financial crash, when equity suffered a fairly catastrophic drop to -39.2% returns, some 15% worse than property, the next worse-performing class. This was followed by a steep climb to 30% returns in equity in 2009 and a rapid fall to -6% in 2011; the effects of the double dip recession. Gilts have only been the most profitable asset class for 2 of the years shown, specifically 2007 and 2008, the years of the financial crash, reflecting their traditional reputation as a relatively low-risk, reliable-return investment in the falling interest rate environment. However, government bonds have shown negative returns since 2013, something that Baroness Altmann, in a recent speech to the ERC, attributed to the continued use of quantitative easing. This, she claimed, had turned gilts ‘from risk-free returns into return-free risk’.
What does the chart show?
The chart shows the percentage return on investment in three asset classes from the years 2003 – 2016: global equity, global government bonds and commercial property in the UK. The grey line represents commercial property in the UK; the orange line represents global government bonds and the blue line represents global equity. The return on investment ranges from -39.2% to 30%.
Why is the chart interesting?
Global equity returns have been diminishing since 2013, which is attributable to a range of factors, not least widespread geopolitical uncertainty. The drop in oil price, which has been disastrous for oil companies as well as the effect of low interest rates are two further drivers in this downward trend. All commodities suffered in the global crash, but prices have begun to climb in 2016, following commitments from the US and Chinese governments toward large-scale infrastructure projects.
Returns from investment in commercial property in the UK climbed from 2003 to 2004, and remained above 18% until the financial crash. Although equity return recovered swiftly at the start of 2009, this increase was considerably more cautious in commercial property. Indeed, it was only in 2014 that returns on commercial property investment recovered to pre-crisis levels.
Compared to asset returns in cash, commodities and credit, the three assets compared in the graph yielded the highest returns over the last decade. An investment of £100 in equity in 2003 would have seen a return of £307, the same into property would have yielded £271 and into government bonds, £168. With volatility indices at an all-time low, the chart shows the increasing merit of a diversified portfolio in the years since the crash.

