Summary
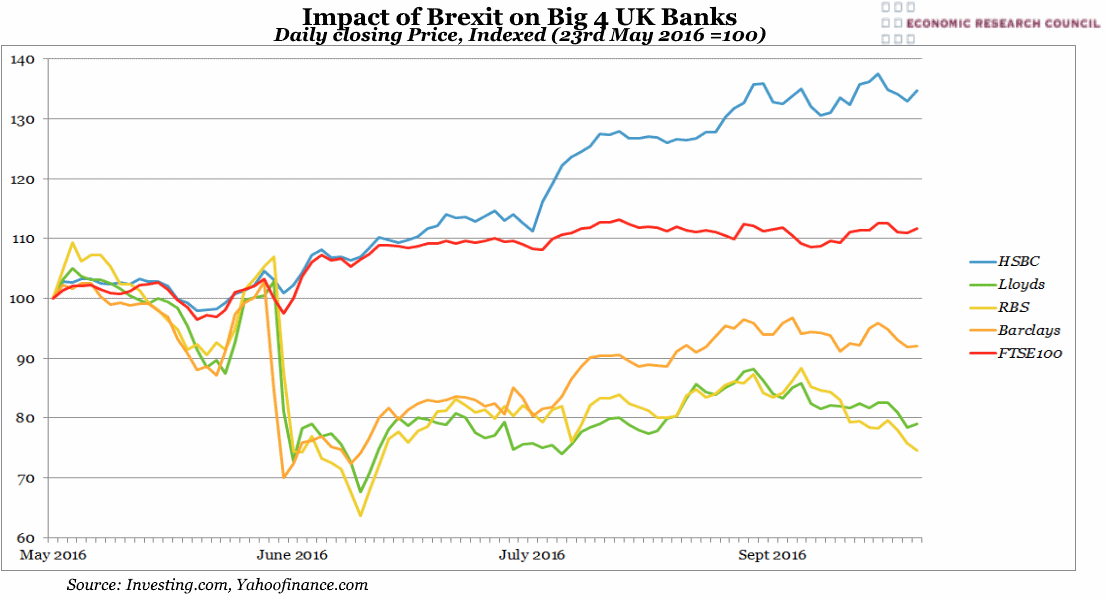
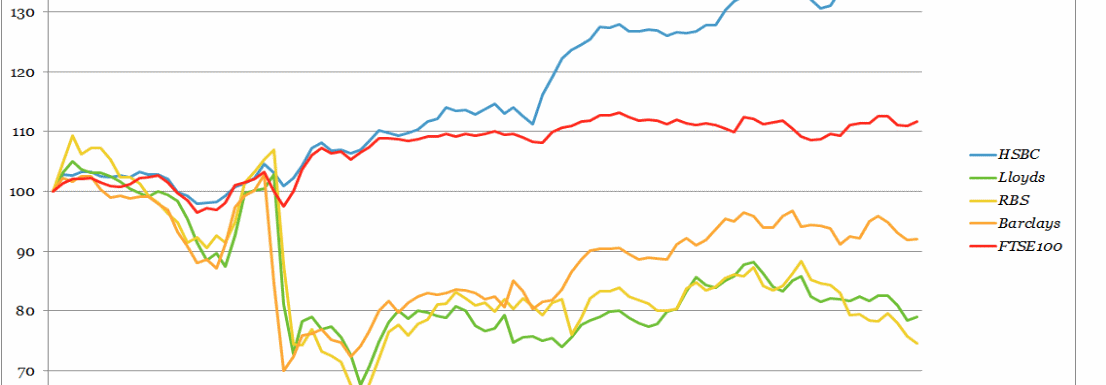
After the collective downturn following the Brexit vote in June (a dramatic 30%), RBS, Lloyds and Barclays share prices have remained well below their pre-referendum rates. However, HSBC has not only shown greater resilience than its UK competitors since the vote, but it has in fact gone on to out-perform the FTSE 100 in the period after July.
What does the chart show?
The lines plot the daily adjusted closing price of each of the big 4 UK banks alongside the FTSE 100. This has been indexed to the price one month before the referendum (23rd May 2016).
Why is the chart interesting?
The chart likely reflects speculative investors’ anxiety around the ‘passporting’ of UK banks following the Brexit referendum. HSBC’s performance, however, shows the extent to which its operations are more globally spread, as well as reflecting their decisive stance on moving their HQ to Paris should the UK leave the single market. The two bailed-out banks, Lloyds and RBS have suffered the worst, contrary to predictions by some analysts who thought that Barclays, which has the highest exposure to London and Investment Banking, would be hardest hit.

