Summary
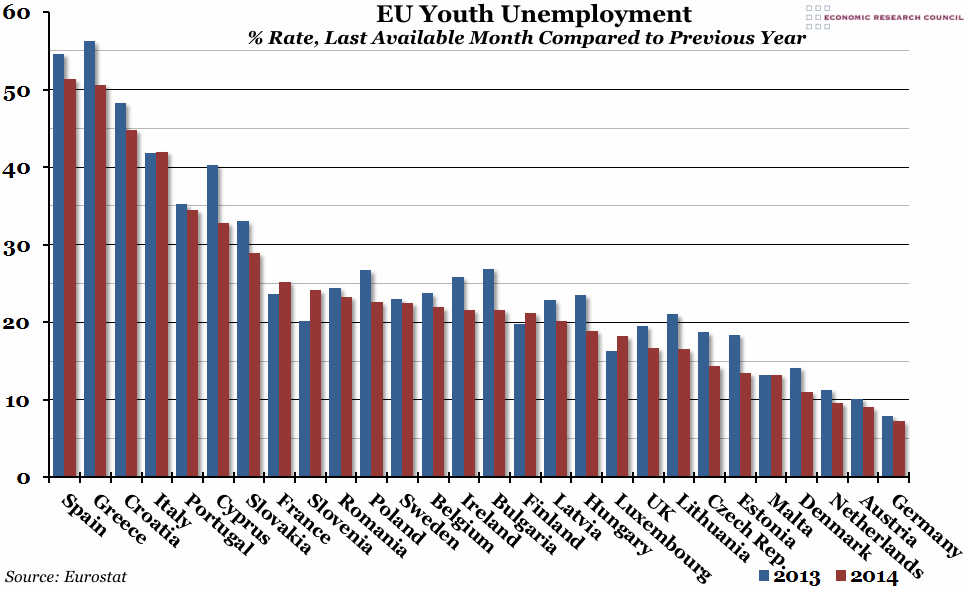
European unemployment figures for December 2014 were released at the end of last week, and both the headline figure and youth unemployment were down compared to the end of 2013 (unemployment was down from 10.6% to 9.9% and youth unemployment was down from 23.1% to 21.4%). However, as usual with Europe, there were some large regional variations.
What does the chart show?
The chart shows the youth unemployment rate (in %) for each of the 28 EU countries. The red bar shows the latest available monthly figure (December 2014 for most of them; November for Estonia and Hungary; October for Greece and the UK; and September for Latvia). The blue bar shows the figure for the same period a year ago. Eurostat defines the youth unemployment rate as the percentage of the labour force aged between 15-25 (ie. all those in work or currently looking for work) who are currently unemployed.
Why is the chart interesting?
High youth unemployment has been a prominent feature of the European recession, and in most places it is now starting to get better. In some countries, youth unemployment has fallen by a lot: for example, Cyprus, Greece and Bulgaria all saw large decreases over the past year, while Estonia, the Czech Republic and Denmark all also saw large percentage decreases (from a smaller base). In fact, Greece has improved by so much that Spain has now overtaken it as the European country with the biggest youth unemployment problem. The UK has experienced a modest decline in youth unemployment over the period, keeping it in 9th place (the same as last year).
However, in a few countries in the EU, there have been increases in youth unemployment. This is most worrying for Italy, France and Slovenia because they already had significant youth unemployment problems (although Luxembourg and Finland also saw small rises). For those countries, things look like they are getting worse, not better.
You can listen to Greg Opie talking about this Chart of the Week on Share Radio by clicking here.

