The Office for National Statistics has pointed out in this month’s Economic Review that the increasing propensity for employees to move jobs is, perhaps even more than falling unemployment, a key indicator of the labour market recovery.
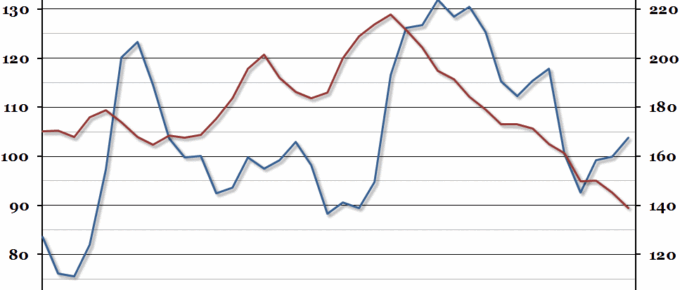
Chart of the Week: Week 40, 2014: Effective Exchange Rate
The decade leading up to the 2008 financial crisis was characterised by a very high real effective exchange rate, but also a period of serious decline for the UK manufacturing sector.
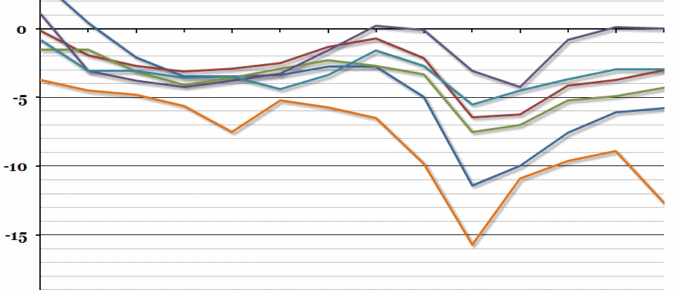
Chart of the Week: Week 39, 2014: European Government Deficits
UK public sector finances were released yesterday, showing that the deficit so far this financial year is higher than last year.
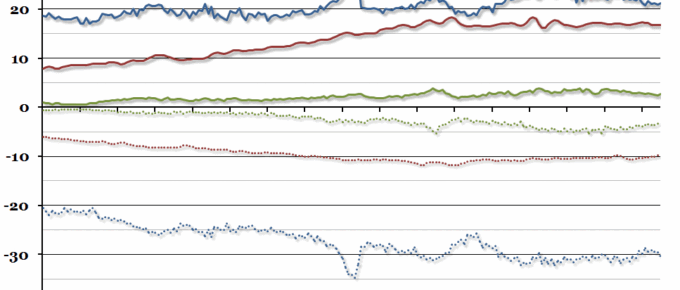
Chart of the Week: Week 38, 2014: UK Trade Balance
Last week it was reported that the UK’s balance of trade deficit increased to an estimated £3.3bn in July, compared to £2.4bn the previous month.
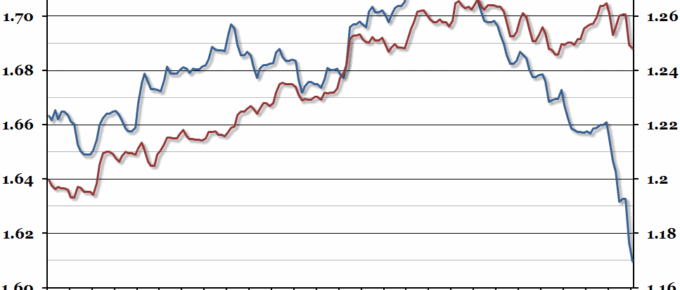
Chart of the Week: Week 37, 2014: Sterling Exchange Rate
With the Scottish independence referendum due to take place next week, a poll released a few days ago suggesting that the “Yes” vote might actually win sparked panic, causing a fall in the value of the pound.
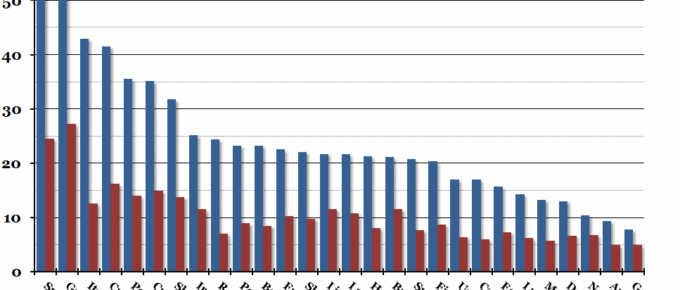
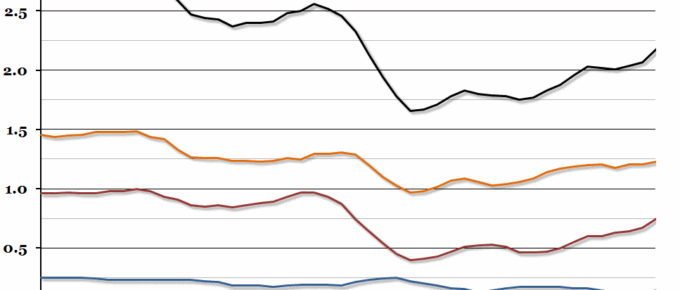
Chart of the Week: Week 36, 2014: EU Unemployment Comparison
Eurostat published their unemployment update at the end of last week, showing that the rate across the EU28 has fallen from 10.9% last year to 10.2% in July.