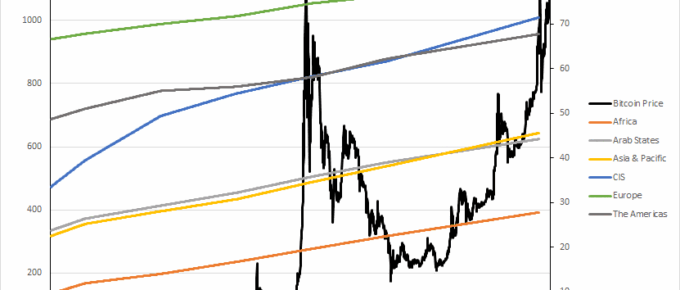
The chart shows that Bitcoin is a niche market which bears no correlation to the number or distribution of individuals across the globe who have internet access.
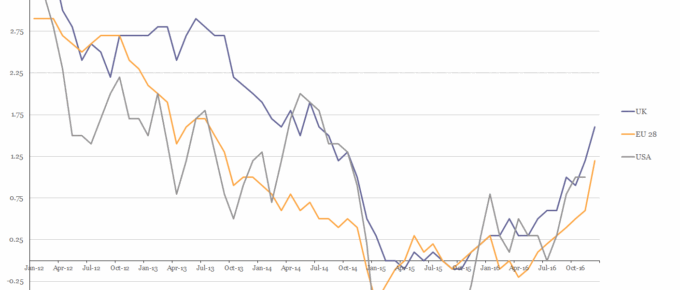
Chart of the Week: Week 6, 2017: USA, EU28 and UK Inflation
The chart shows that in 2016 the HICP rate of inflation for all three parties rose above 1% for the first time in over 2 years.
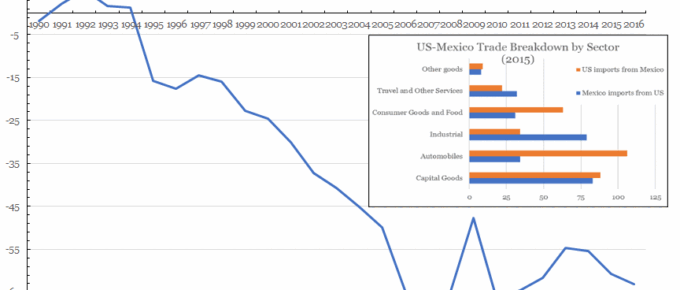
Chart of the Week: Week 5, 2017: US Trade with Mexico
The chart shows that the US has been in trade deficit with Mexico since Clinton came to power, with George Bush Jnr presiding over the period with the largest deficit increase; around $29 billion.

February 2017
The economic dislocation following the financial crisis is receding and business in general seems to have adjusted to a world of growing uncertainty on the political as well as the legislative front. Perhaps…